Methodologies
The work scales
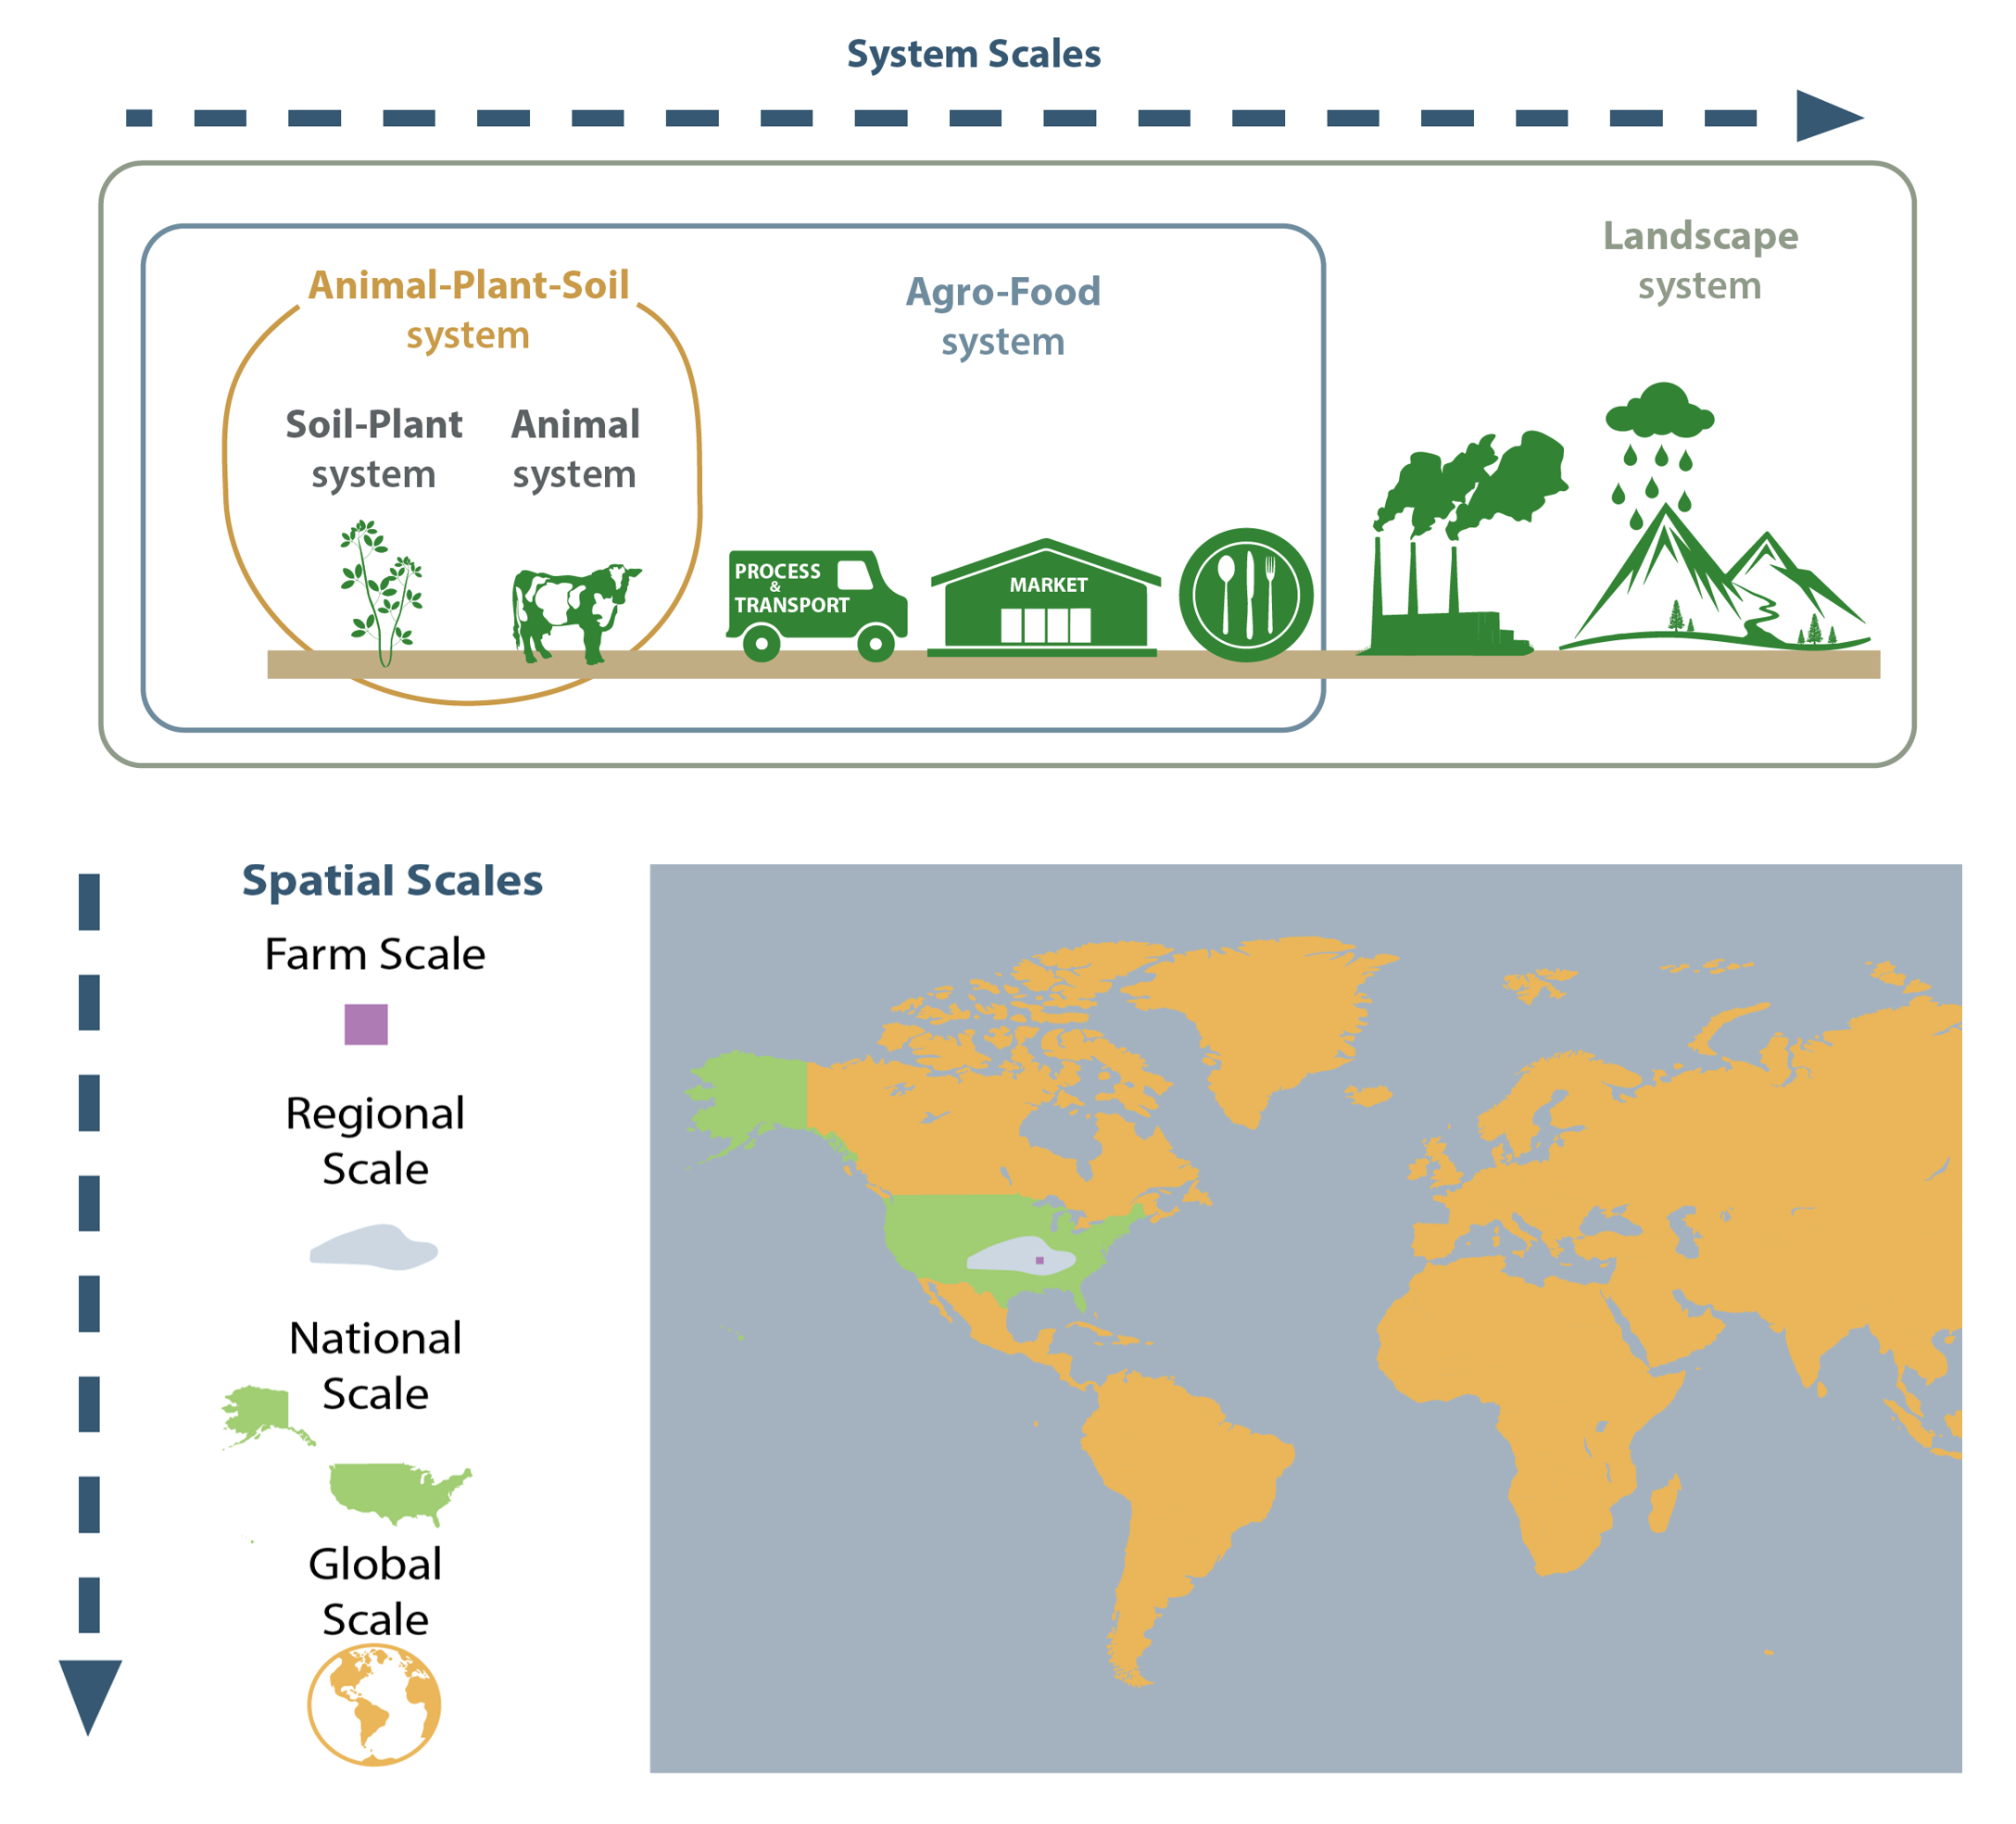
AgrosceNa-UP is a project that addresses sustainability from an integrative and multi-scale approach. A good definition of the scale of work and the system limits considered has been central to all project activities. For this we have based ourselves on the organization proposed by Zhang et al. (2020) to establish the spatial scales (plot, exploitation, grid, region, river basin, country and global) and system scales (crop, livestock, mixed and agri-food system). Any approximation or estimate that involves a change in scale to a higher one is considered “upscaling” and vice versa “downscaling”. In Agroscena-UP we have considered the spatial scales of “grid”, region and national and continental, as well as the nested system scales including crops, livestock and agri-food system.
The long-term series

In AgrosceNa-Up, the study of the historical evolution of Spanish agricultural systems is essential as a strategy to understand the changes and their consequences as a basis for developing appropriate scenarios. To this end, nitrogen budgets have been reconstructed in cropping systems at the province scale in the long term (1860-1990) and at high resolution for the entire agri-food system (1990-2015). In some studies, the database has already expanded to 2018 and the team is working to update it to the present moment. The reconstruction has been carried out with a combination of the best available statistics (beginning in Spain in 1860) in combination with modelling work Aguilera et al. 2021). 2021).
An integrated modelling framework
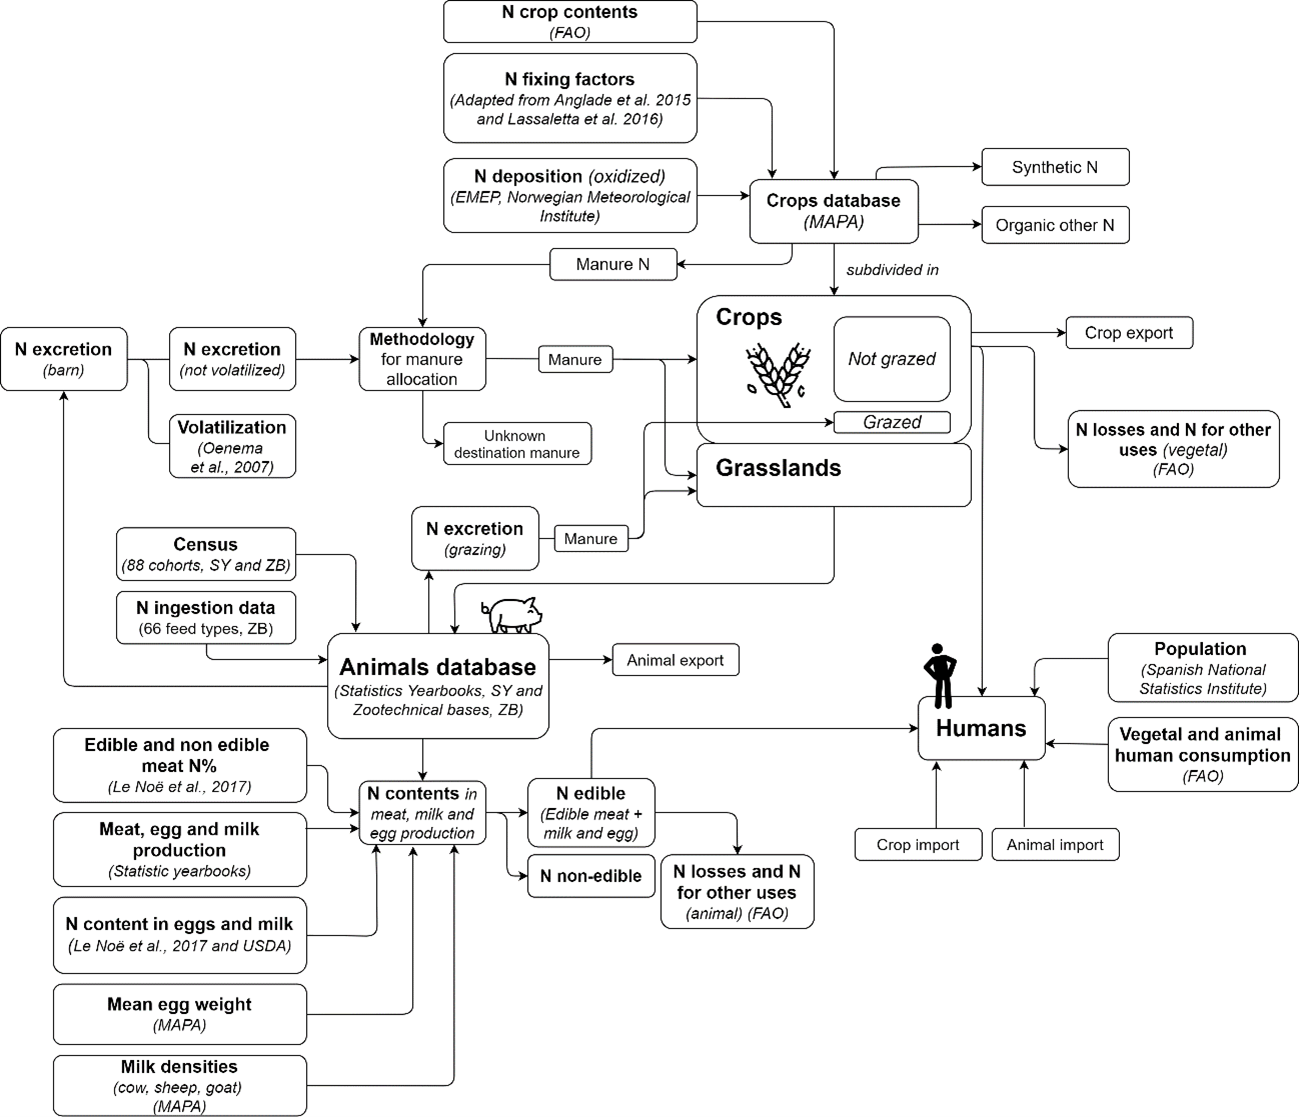
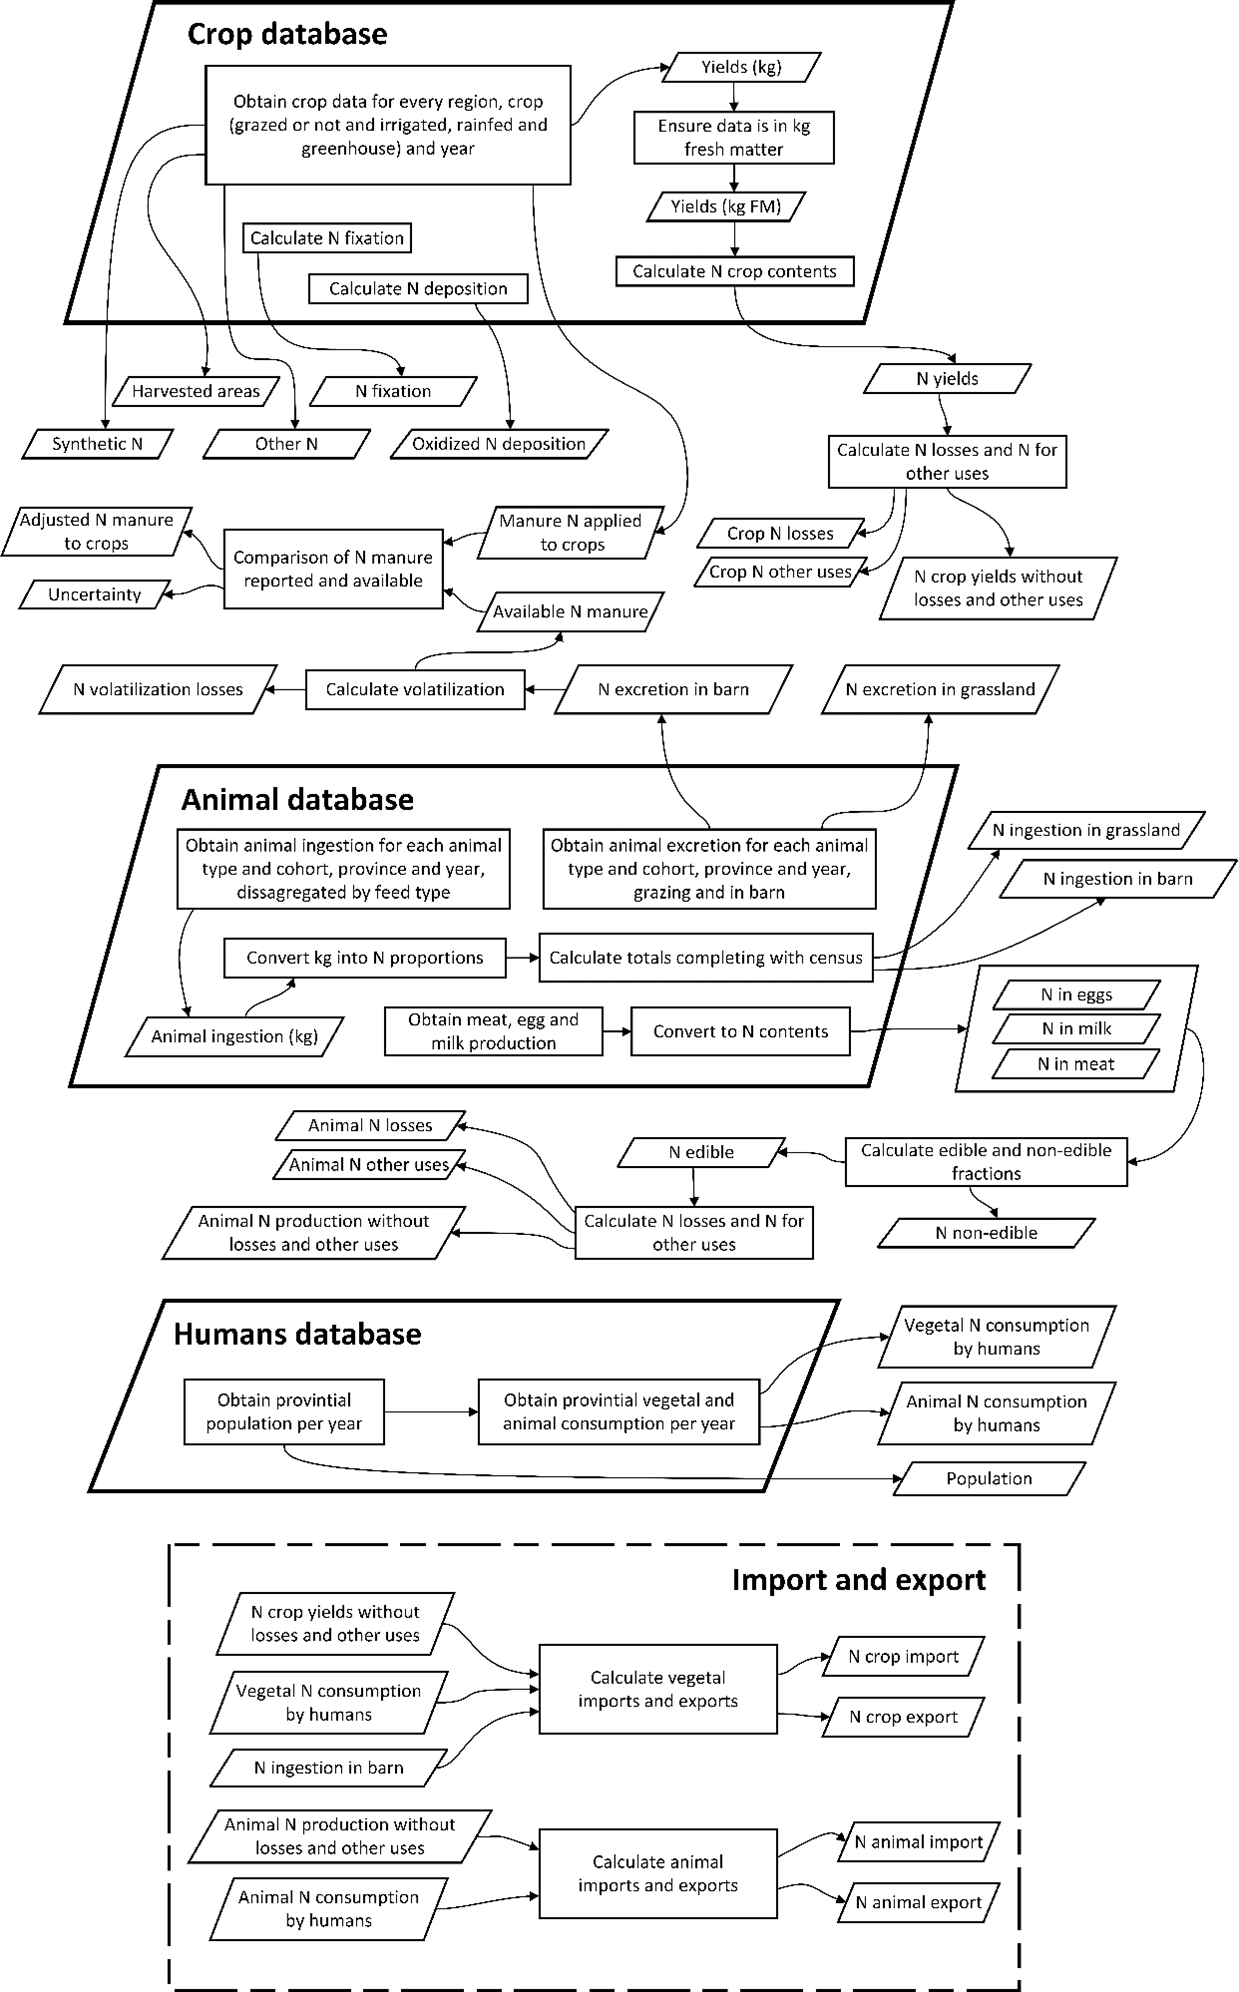

AgrosceNa-UP bases much of its activity on the development of new interconnected databases that result in a multiscale model of the agricultural and agri-food system of the provinces of Spain for the period 1860-1990 in less detail and 1990-2015 in a great detail (Download methodology).
The result has made it possible to establish and analyze the different N flows, the characterization of the provinces in typologies, the degree of dependence of a province on the outside.
Based on the MAPA databases on crops and budgets, nitrogen balances were established in dryland, irrigated and greenhouse, including mineral and organic fertilization, which were subsequently adjusted and spatialized at the grid scale. To do this, it must be processed from numerous data sources with a high degree of detail. For example, details of the intake of the different categories of animals, each subdivided into different cohorts (88 cohorts in total), for each province and year were obtained from the MAPA Zootechnical Bases, along with other data such as those contained in N of the different crops, meat, milk, eggs produced, data from Statistical Yearbooks to complete or improve the information provided, and with many other parameters, it was possible to obtain said intake in terms of nitrogen, of each animal in each province and year for each of the nearly 100 animal feedstuff that make up livestock rations were associated with the crop of origin. On the other hand, excretion in terms of N was also obtained by provinces and years, also identifying the parts excreted directly in crops or pastures. The manure use data obtained from both the crop and animal components were used to validate the data, as well as to locate to a certain level of detail the possible flow of manure transport between provinces following a specially designed algorithm. effect. Losses of both animal and plant products were taken into account. The N deposition was also estimated, as well as the biological N fixation. On the other hand, population and food demand data were collected for each province and year. The model allowed us to calculate the degree of regional dependence. Finally, other flows such as excess N or losses due to volatilization in manure were calculated.
The agroenvironmental indicators
AgroesceNa-UP considers several indicators with which to evaluate the agro-environmental sustainability of the proposed strategies. N2O emissions have been estimated by applying specific emission factors adapted to the Mediterranean region, ammonia emissions by using the MANNER model. Eleven indicators were grouped into four groups have been established.
- Agronomic indicators: yield and NUE.
- Nr emissions per area: kg N-NH3/ha, kg N-N2O/ha, kg N-surplus/ha.
- Yield-scaled emissions: kg N-NH3/kg N product, kg N-N2O/kg N product, kg N-surplus/kg N product.
- Economic indicators: € agricultural products, € fertilizer expenditure, € balance.
Nitrogen budgets in croppping systems

Nitrogen budgets in crops at different levels of spatial aggregation are represented in the 2D diagram proposed by the European Nitrogen Experts Panel (EUNEP). A diagram that integrates in a very visual way the multidimensional agri-environmental aspects of a N budget. This representation includes N inputs and outputs, as well as nitrogen efficiency (NUE) ranges and surplus.
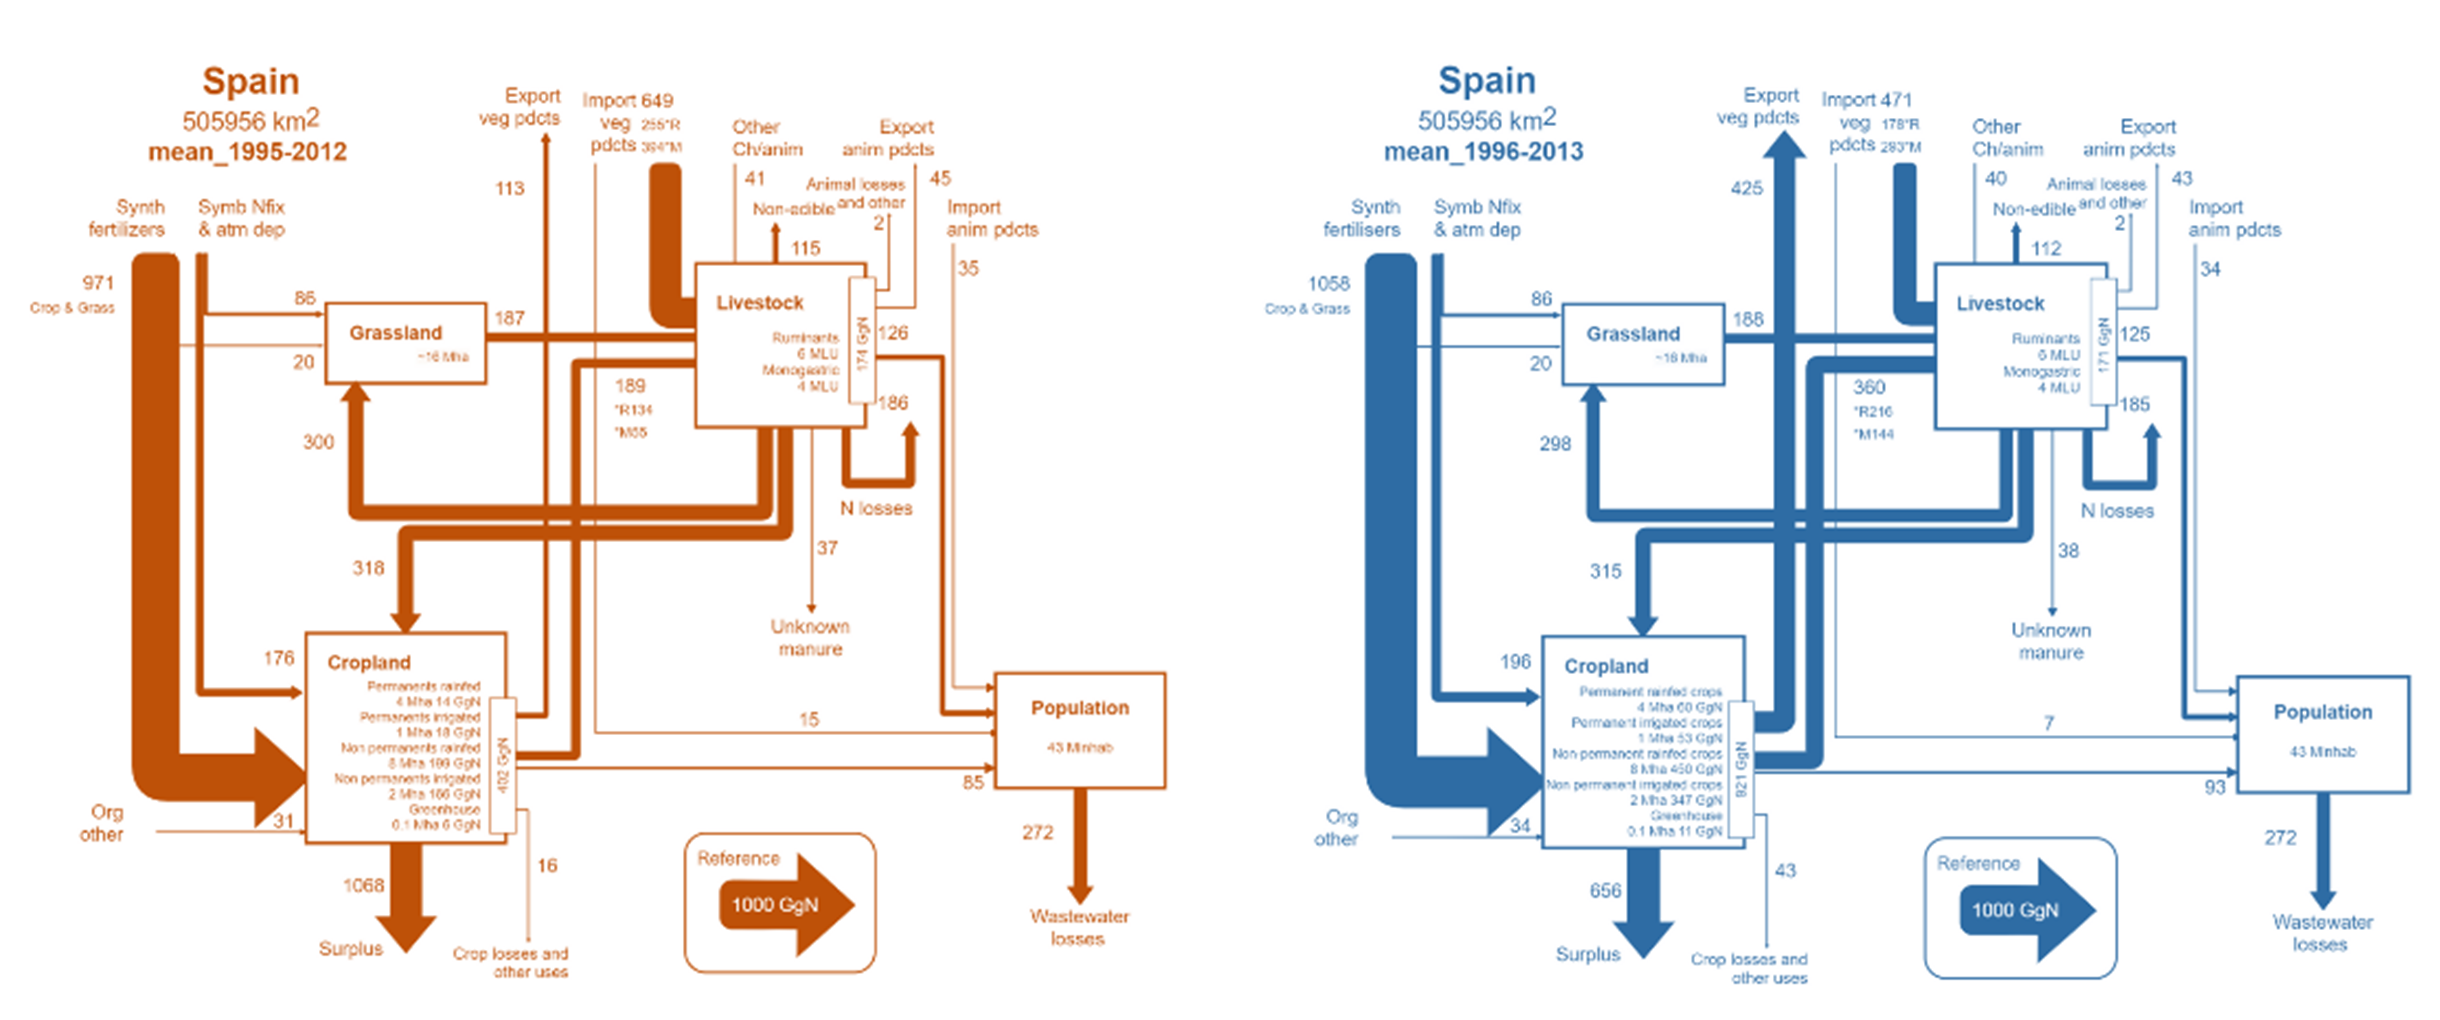
The GRAFS approach
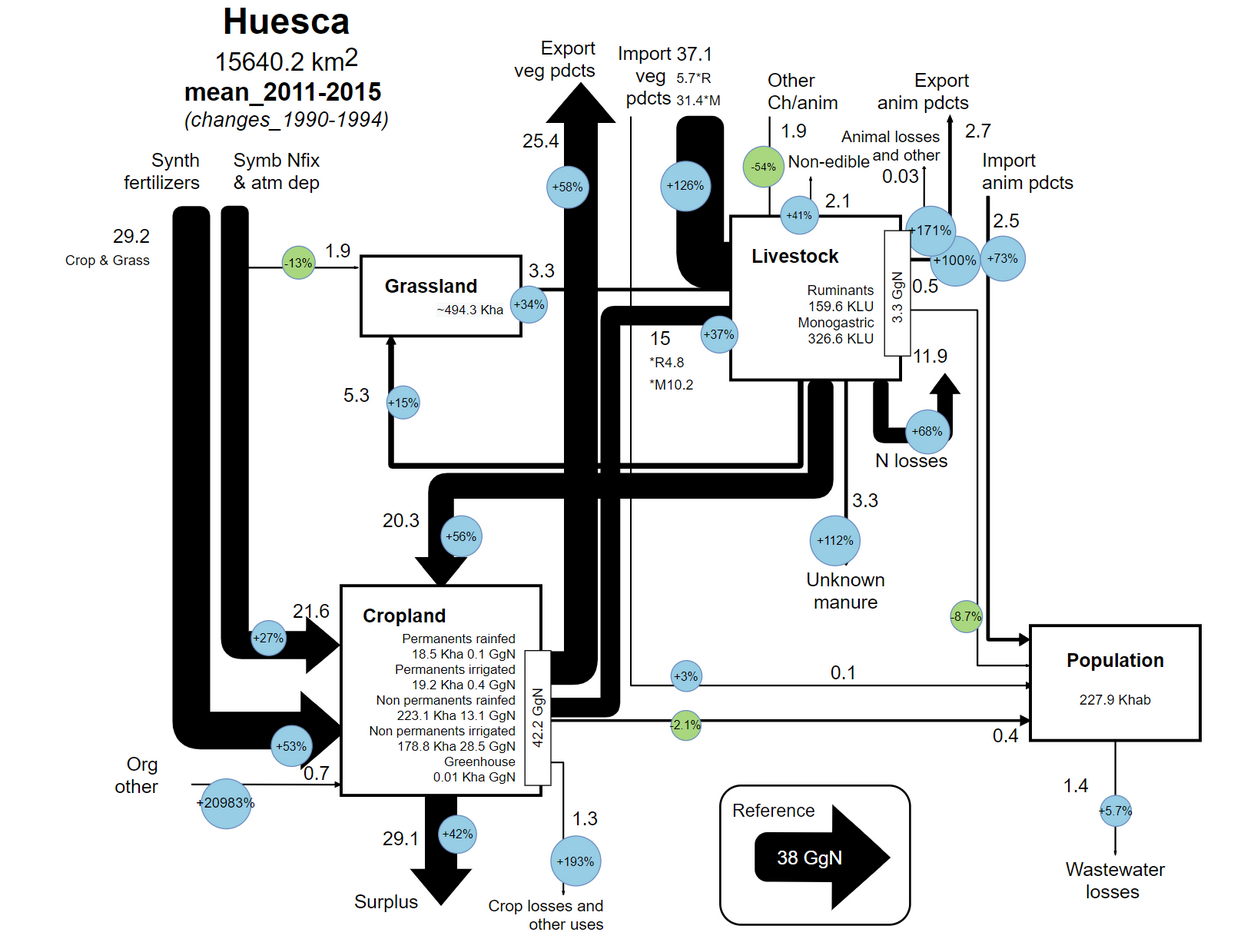
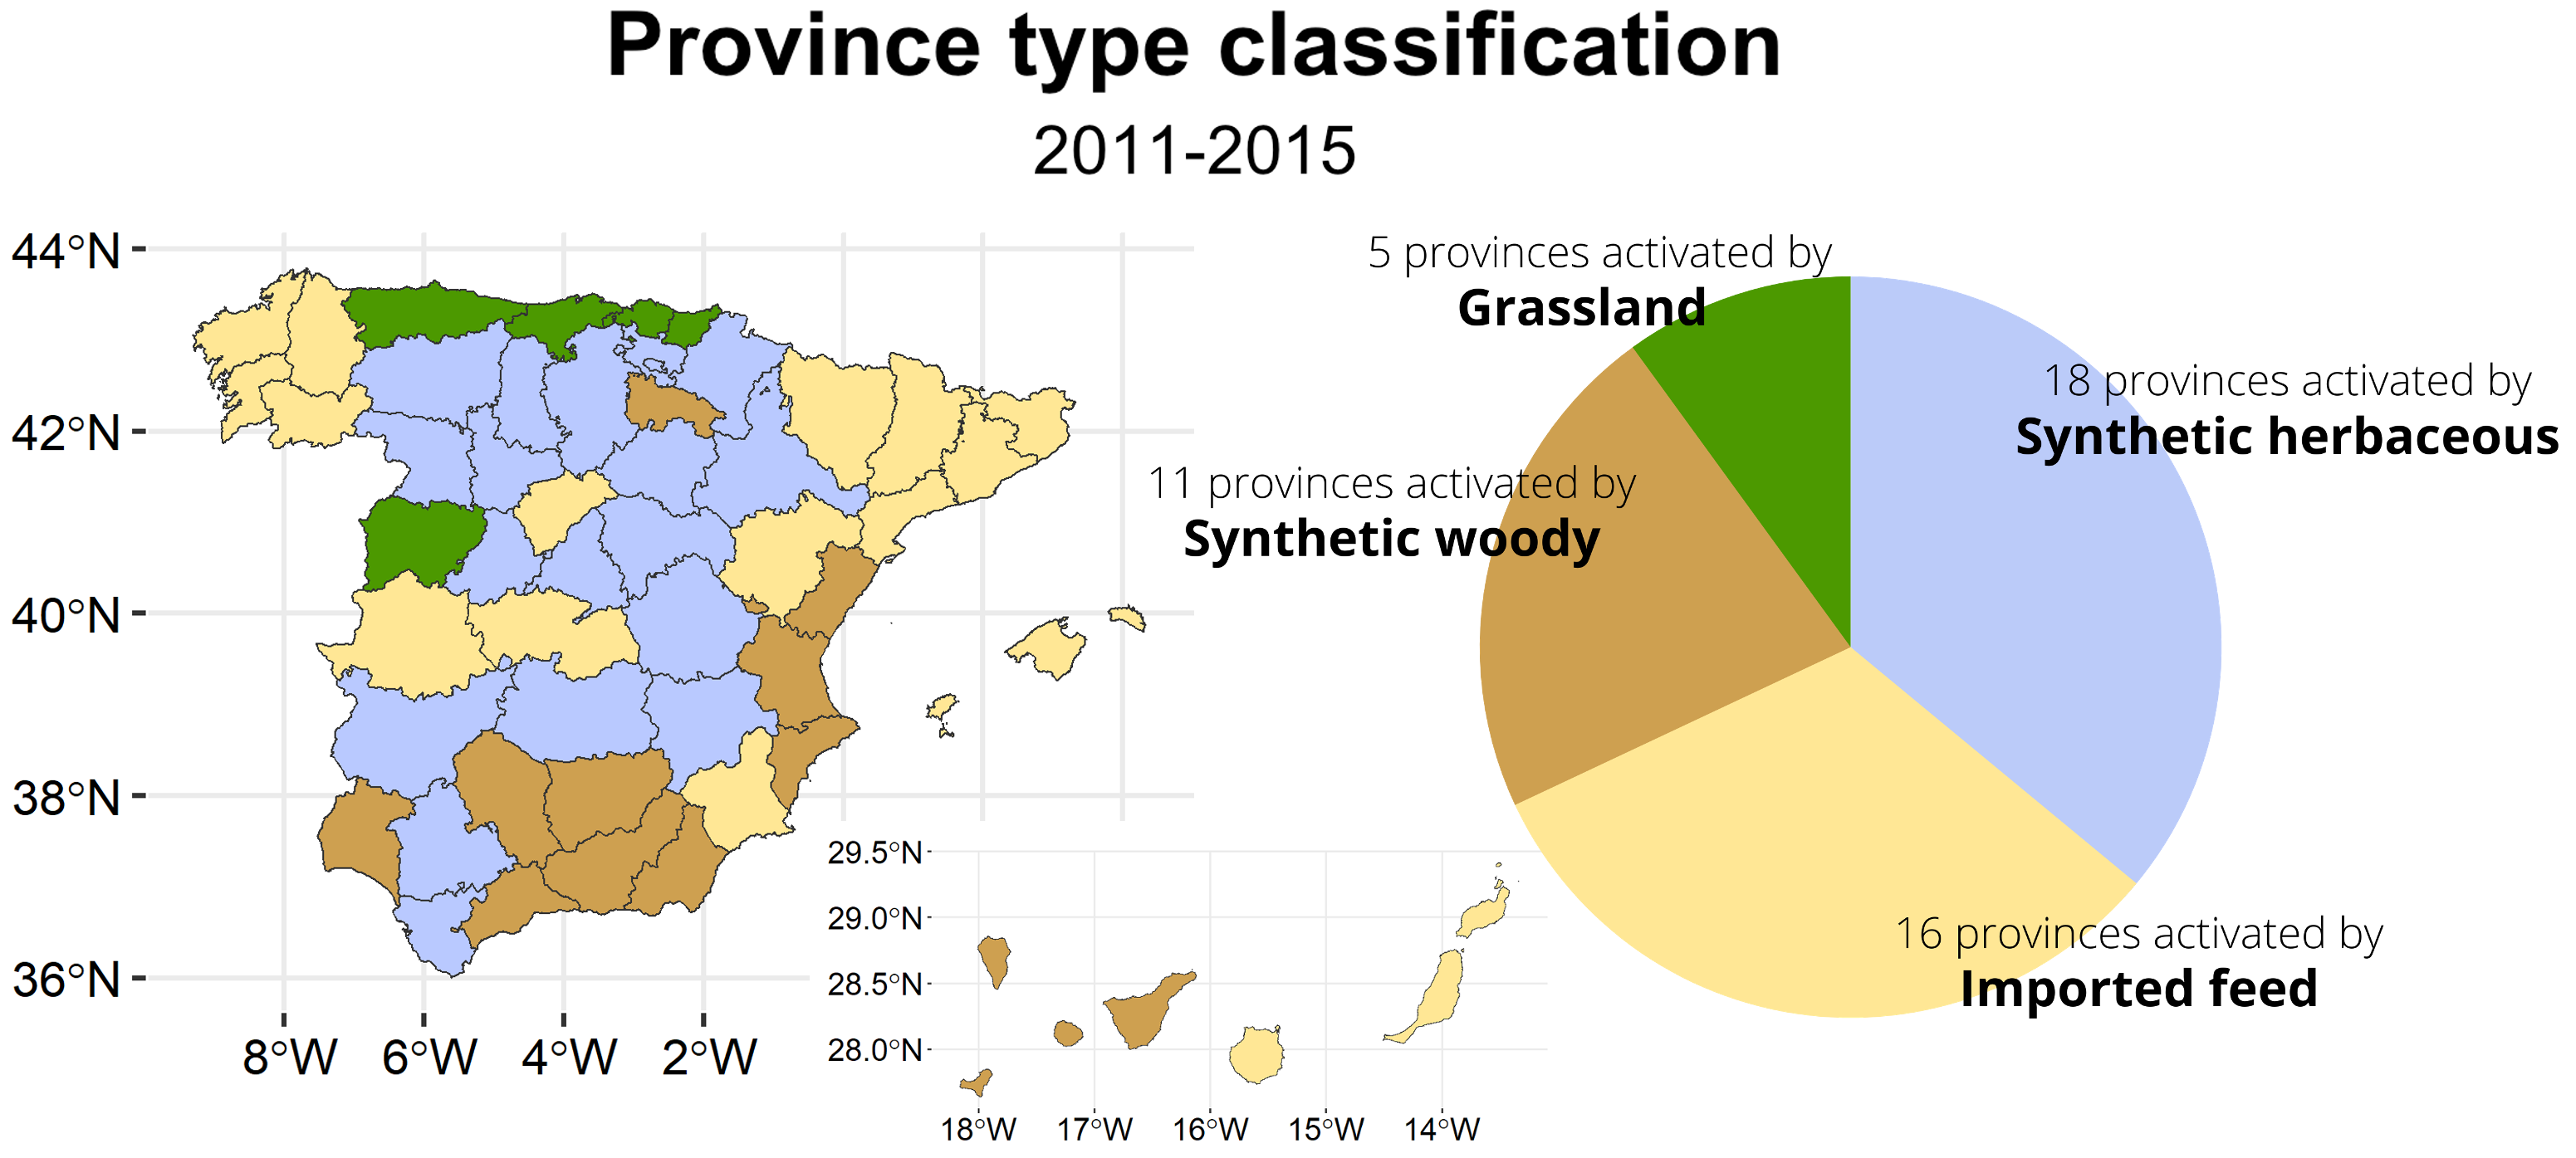
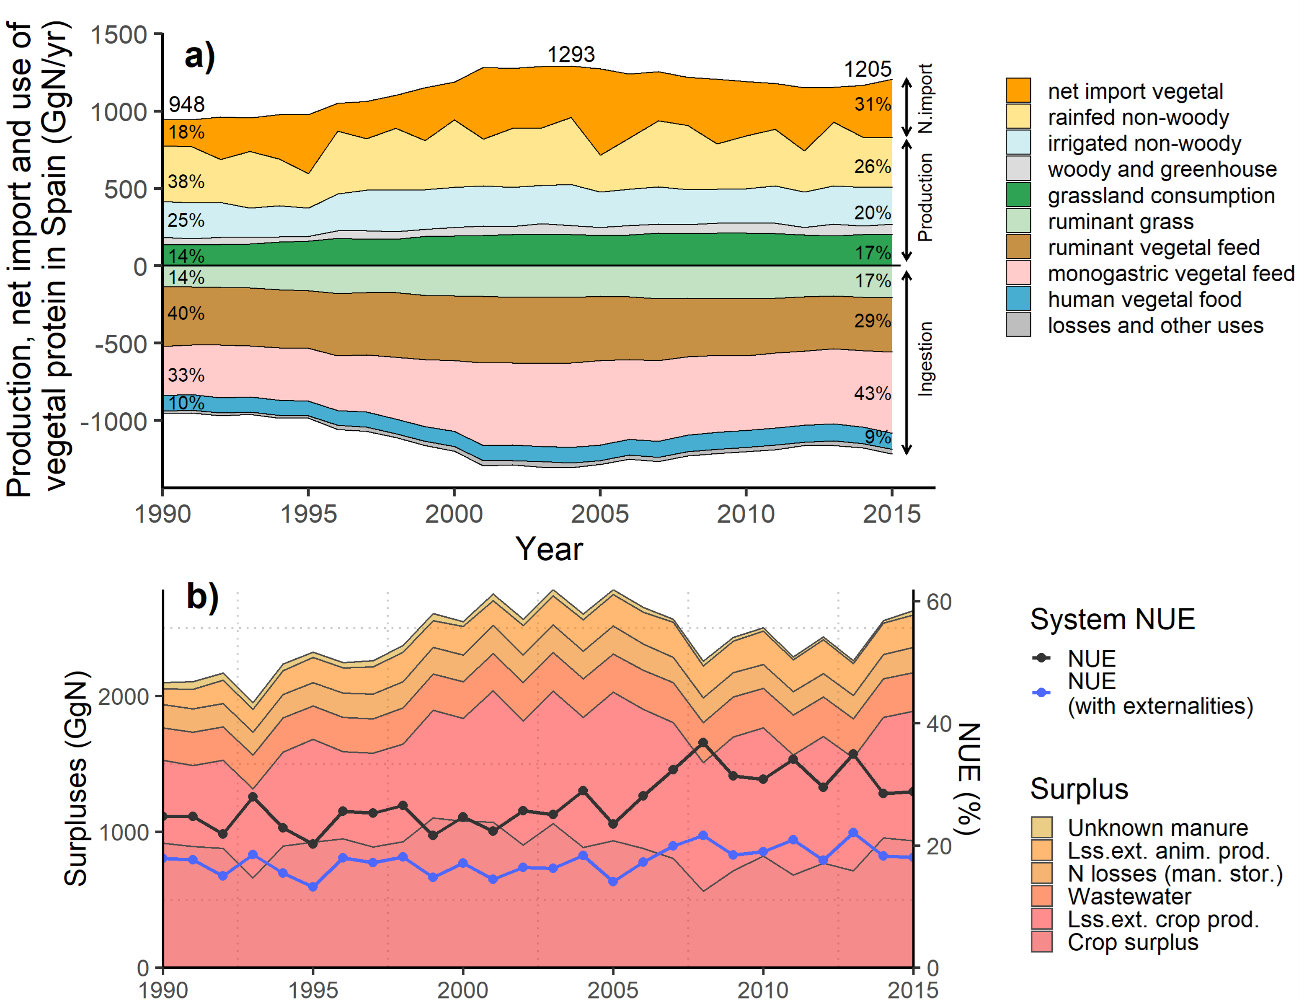
The GRAFS (Generalized Representation of Agrofood Systems, Billen et al 2014 2014) methodology was used to represent the nitrogen flows obtained from the integrated model, both the Spanish agri-food system and of each of its provinces. This methodology allows to visually analyze the flows (in this case of nitrogen) between the main compartments of the agri-food system: crops, pastures, livestock and population. In addition, this was expanded to show (through bubbles) the change produced compared to 20 years ago with respect to the period analyzed from 2011 to 2015. The result allowed us to establish four typologies of quantitative provinces: synthetic fertilizers in herbaceous, woody, grass and importers of animal feed, according to the predominant relevance in the flows.
The spatialized N budgets
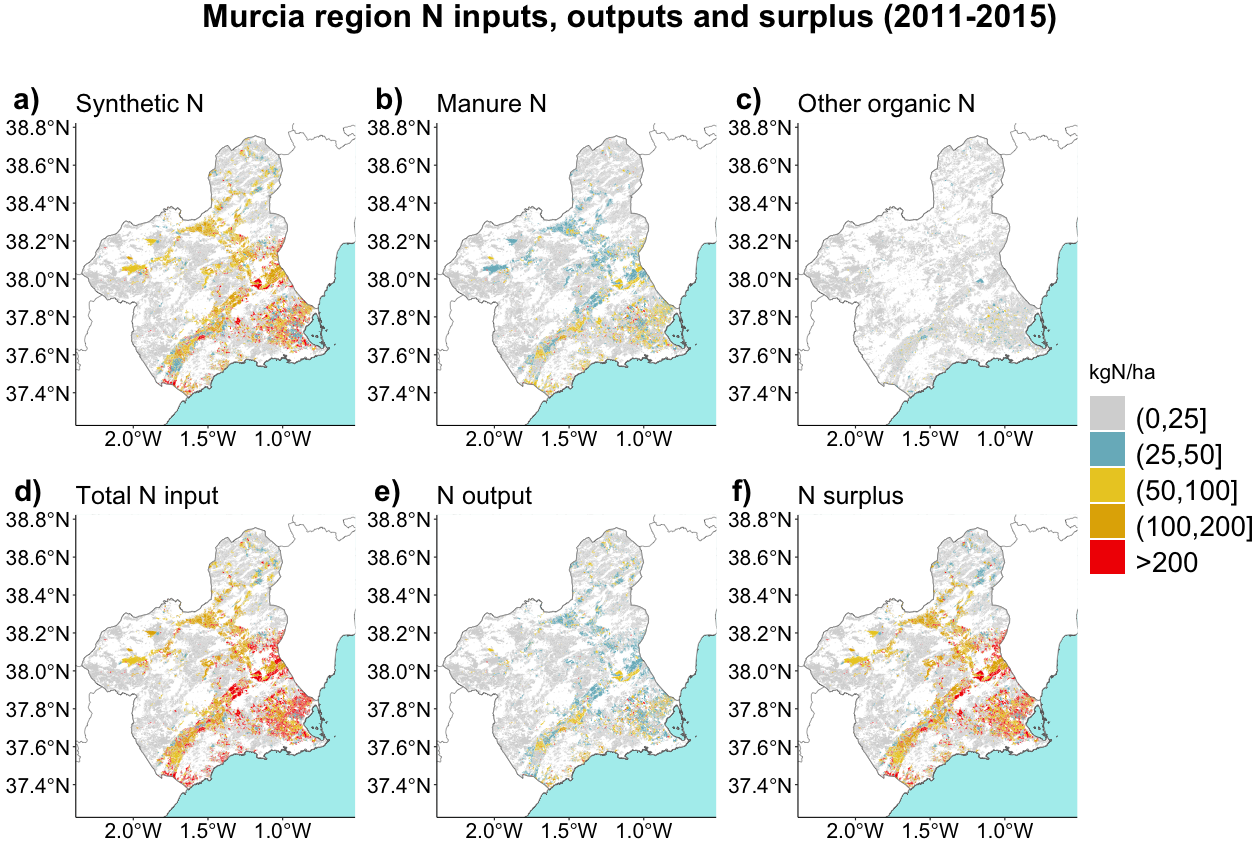
Once all the information presented above was generated at the provincial level, the SIOSE soil database was processed based on the year 2014 to spatialize the different results. When the land use database was processed, the results related to the different crops were grouped into 12 SIOSE categories. In this way, every crop budget result was spatialized: production, inputs, surpluses, emissions, benefits, costs, etc. In the same way, this option is an interesting tool to show results of the different scenarios described in the following section. Una vez procesada la base de datos de usos suelo, se procedió a agrupar los resultados relativos a los diferentes cultivos en torno a 12 de las categorías SIOSE. De esta manera se pudo espacializar cualquier resultado relativo a los cultivos: producción, insumos, surpluses, emisiones, beneficios, costes etc. De la misma forma esta opción es una herramienta interesante para mostrar resultados de los diferentes escenarios descritos en la siguiente sección.
Scenarios
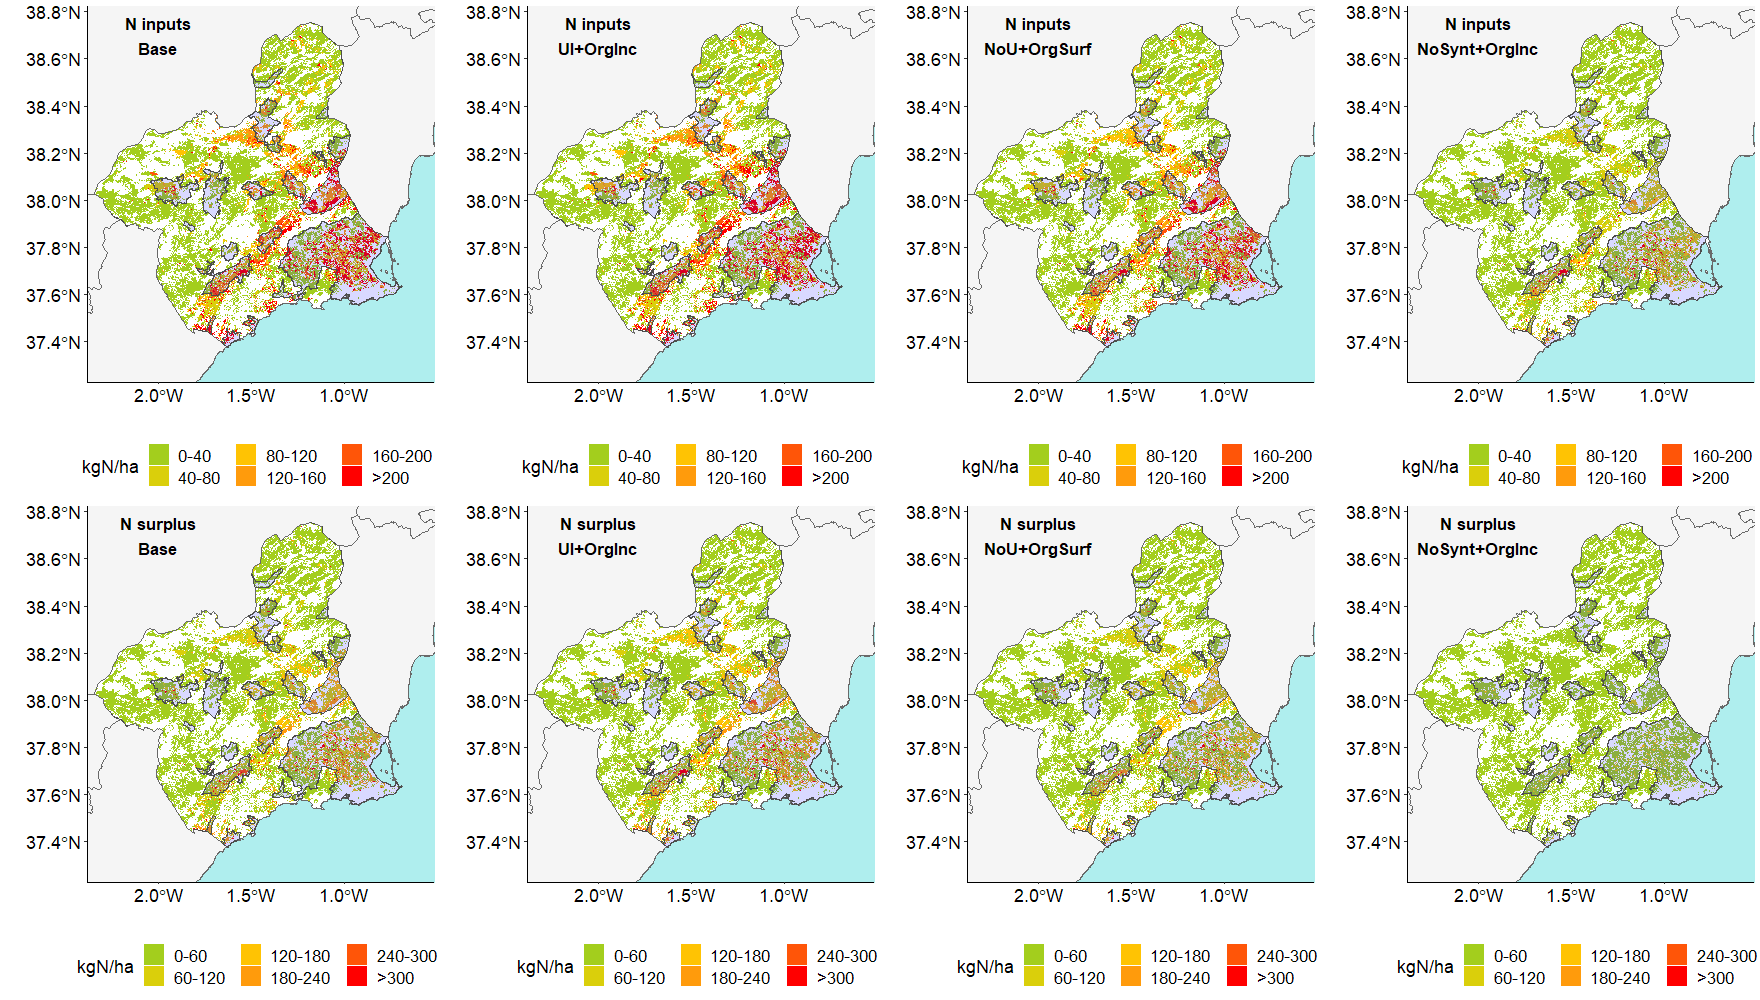
InAgrosceNa-UP we have taken as a starting point the recent reality of the agricultural systems of the years 2011-2015. Based on this reference situation that we call “baseline scenario”, we have compared changes in crop management with a focus on nitrogen fertilization. These alternative scenarios are the result of co-creation with the different actors in the territory and can lead to lower environmental impacts linked to agricultural production. The impact of these alternative practices in terms of crop yield or cost of inputs (fertilizers) for farmers has always been considered. The impacts linked to each scenario are shown in the ON-LINE AgrosceNa-UP tool.
The exploration of uncertainty
The uncertainty associated with the data typically used to represent a system using a GRAFS can cause significant variability in the N budget and therefore in the fluxes shown in the GRAFS. The interpretation of the un certainty analyses was focused on evaluating how differences in precipitation and nitrogen concentration values, [N], affect the result in N fluxes, interpreted with the help of GRAFS, and evaluating the relative importance of this source of uncertainty, usually ignored, depending on the type of province considered. By combining sources of variation, and discretizing these sources at various levels, 6 additional types of GRAFS have been obtained: low [N] value for the average of dry years, low [N] for the average of wet years, [N] high for the average of dry years, [N] high for the average of wet years, [N] low for the average of normal years and [N] high for the average of normal years. These GRAFS were obtained at both the national and provincial levels.
The field trial
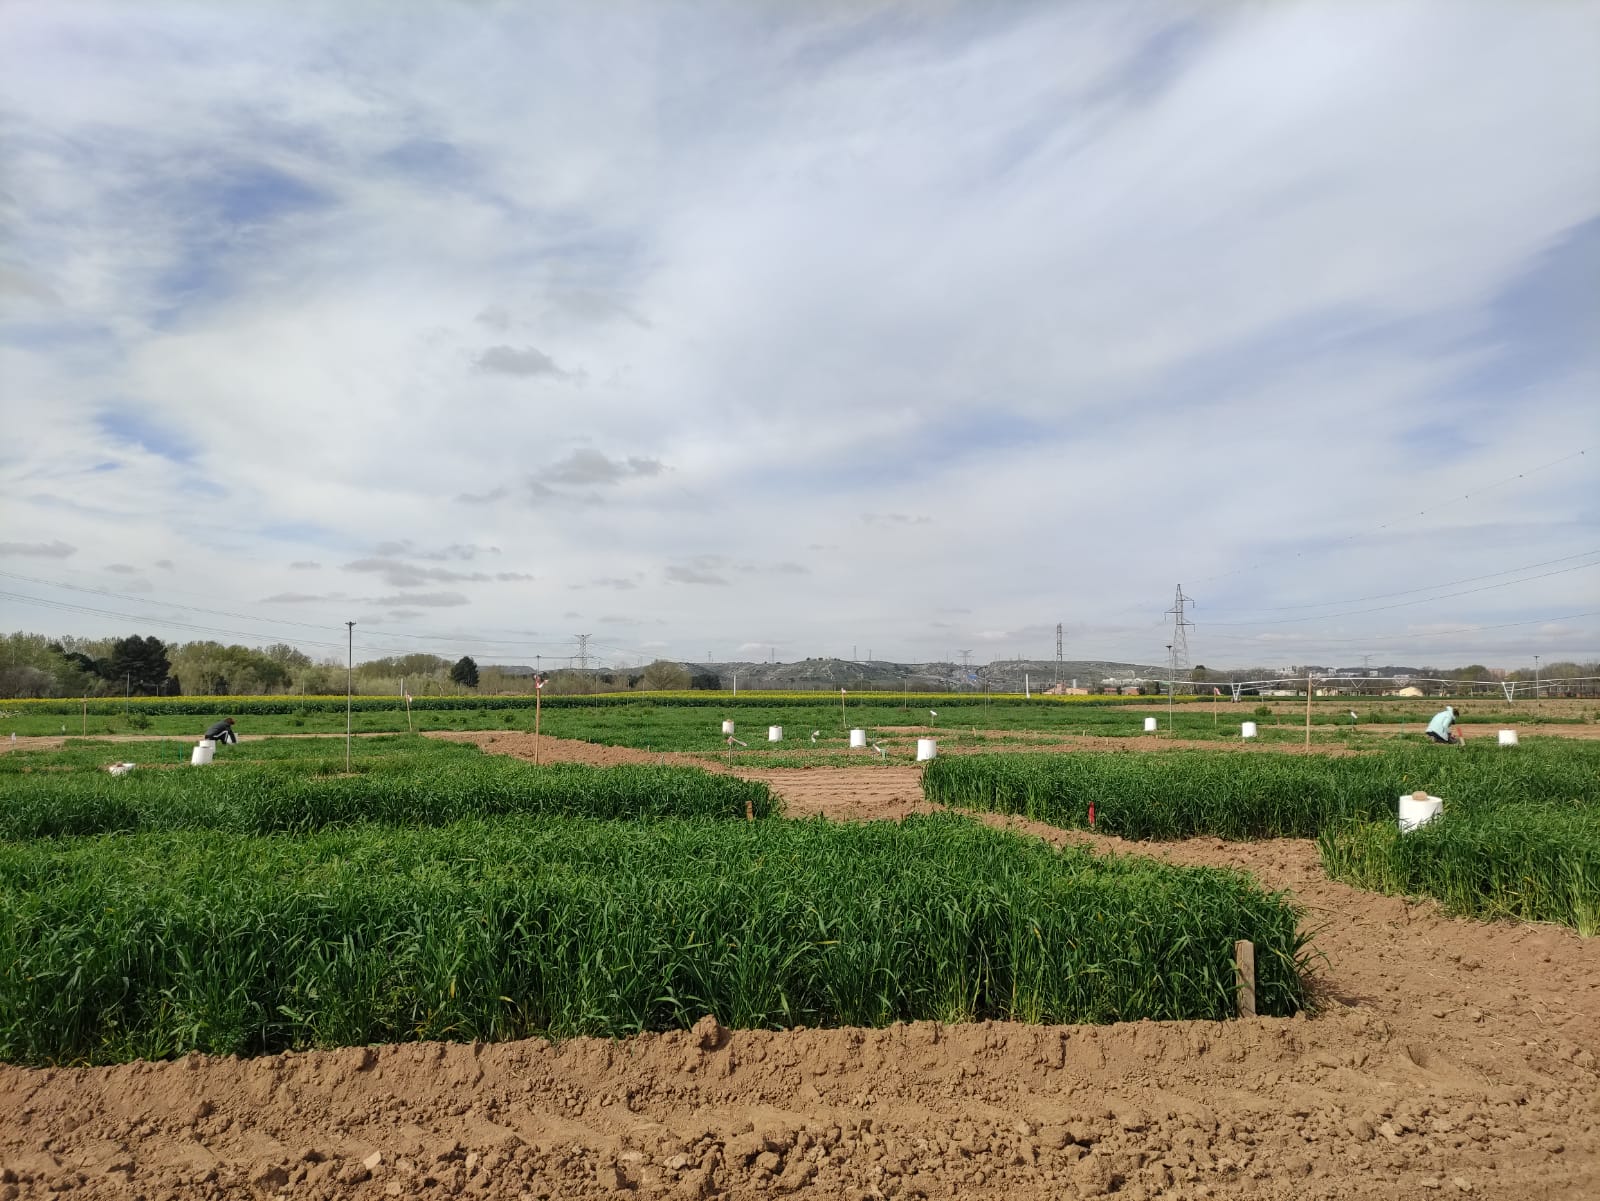
A trial was carried out with barley with the aim of studying synergies between adaptation and mitigation to climate change in the context of the EU Farm to Fork Strategy, through fertilization management and sowing date selection. The selection of the barley variety (RGT Planet) and the fertilization treatments (3 treatments and a control) were co-designed through a participatory cocreation workshop in which representatives of farmers, environmental organizations, the CENTER, and the academia participated. The rainfed barley trial was carried out in two annual cycles (2021-2023). For each treatment (3 replicates), greenhouse gas emissions were measured using static chambers, soils were analyzed and phenology was studied, as well as the yield components. The trial was carried out at the National Center for Irrigation Technology (CENTER) in the Community of Madrid (Spain).
Crop modelling
Crop models are computer programs that, based on data that describe the soil, climate, crop management and genetic characteristics of the plant, estimate the progress of its phenology, the accumulation of biomass and the components of the crop performance. AgrosceNa-Up field trials have allowed us to begin generating a database on the phenology and growth of the Planet barley variety. Calibration of the CERES-Barley crop model of the DSSAT4.8 platform was carried out, adjusting the plant genetic parameters that determine the duration of the vegetative part of the cycle and that of grain filling, as well as the parameters that determine the harvest index and yield. The DNDC model was also calibrated and validated including corn data from various trials. The models were used to carry out the agro-environmental sustainability and adaptation to climate change of these crops over the next 40 years with different nutrient and climate management scenarios.